SellerHelpDesk Case Study | Meesho Marketplace Growth
Growing a Meesho business at scale requires more than simply listing products. Consistent marketplace growth depends on visibility, traffic, conversion, product performance, order management and continuous optimization.
SellerHelpDesk worked with a Meesho seller to manage and improve the overall marketplace performance, with July 2026 becoming a major growth milestone.
During the month, the seller generated more than ₹20 lakh in total sales along with thousands of orders.
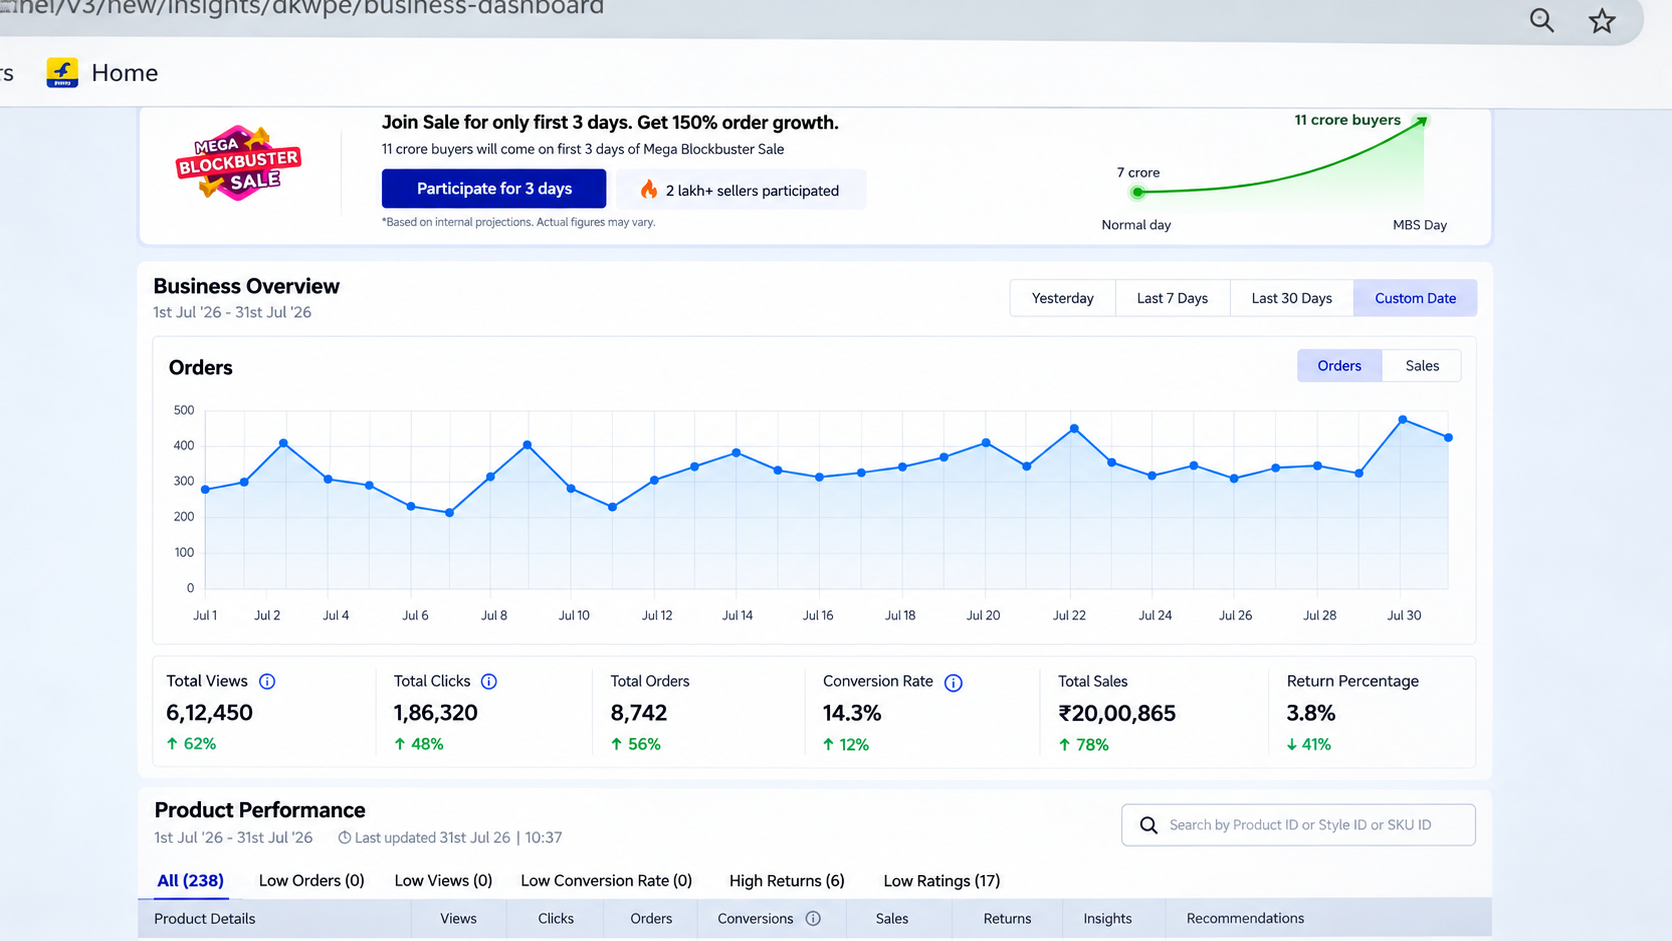
The July 2026 Result
According to the Meesho Business Dashboard for 1 July 2026 to 31 July 2026, the account recorded:
₹20,00,865 Total Sales
along with:
- 8,742 Total Orders
- 6,12,450 Total Views
- 1,86,320 Total Clicks
- 14.3% Conversion Rate
- 3.8% Return Percentage
The dashboard also shows year-on-year/previous-period improvement indicators, including:
Sales: +78%
Orders: +56%
Views: +62%
Clicks: +48%
Conversion Rate: +12%
Return Percentage: -41%
This combination of higher sales and orders alongside a lower return percentage represents a significant improvement in the account’s July performance.
The Challenge
The objective was not simply to generate more orders.
The focus was to build a stronger Meesho business across multiple performance areas:
- Product visibility
- Customer traffic
- Conversion
- Order volume
- Sales
- Product performance
- Return management
- Marketplace operations
As the account grows, managing hundreds of products and thousands of orders requires continuous monitoring and optimization.
Our Approach
1. Marketplace Performance Management
SellerHelpDesk monitored the overall Meesho account performance and tracked key marketplace metrics.
We focused on understanding the relationship between:
Views → Clicks → Conversion → Orders → Sales
This helped provide a clearer picture of where growth was coming from and where further optimization could be applied.
2. Product Performance Monitoring
The account contained a large product catalog.
Product-level performance was monitored to identify products generating visibility, orders and sales while also identifying areas requiring attention.
3. Conversion Optimization
Traffic alone doesn’t create a successful marketplace business.
The account achieved a 14.3% conversion rate during July, showing that marketplace traffic was converting into orders at a measurable rate.
4. Return Management
Returns are an important part of marketplace profitability.
The July dashboard recorded a 3.8% return percentage, with the dashboard showing a 41% decrease in the displayed comparison metric.
This made return management another important part of the overall performance picture.
5. Continuous Growth Management
Rather than treating the account as a one-time project, SellerHelpDesk focused on ongoing marketplace management.
The objective was to build sustainable performance across products, traffic, orders and sales.
The Result: ₹20 Lakh+ Sales in One Month
The biggest milestone came in July 2026.
₹20,00,865 Total Sales
The account also generated:
8,742 Orders
from:
1,86,320 Clicks
and:
6,12,450 Views
with a:
14.3% Conversion Rate
Performance at a Glance
| Metric | July 2026 |
|---|---|
| Total Sales | ₹20,00,865 |
| Total Orders | 8,742 |
| Total Views | 6,12,450 |
| Total Clicks | 1,86,320 |
| Conversion Rate | 14.3% |
| Return Percentage | 3.8% |
Dashboard Comparison Indicators
| Metric | Change Shown |
|---|---|
| Sales | +78% |
| Orders | +56% |
| Views | +62% |
| Clicks | +48% |
| Conversion Rate | +12% |
| Return Percentage | -41% |
From Traffic to ₹20 Lakh+ Sales
The July performance can be visualized as:
6.12 Lakh Views
↓
1.86 Lakh Clicks
↓
8,742 Orders
↓
₹20.00 Lakh+ Sales
This demonstrates the importance of managing the complete marketplace funnel rather than focusing on only one metric.
A Major Improvement in Marketplace Performance
The dashboard’s comparison indicators show improvement across several important metrics.
Sales increased by 78%, while orders increased by 56%.
At the same time, traffic also increased:
- Views increased by 62%
- Clicks increased by 48%
The account’s conversion rate reached 14.3%, while the return percentage was 3.8%.
Together, these metrics provide a broader picture of the account’s July marketplace performance.
The SellerHelpDesk Approach
At SellerHelpDesk, our focus is not simply on generating more traffic.
We look at the complete marketplace operation:
Product → Visibility → Traffic → Conversion → Orders → Sales → Returns → Optimization
By monitoring these areas together, sellers can make more informed decisions about their marketplace business.
The Next Goal: Scaling Further
Crossing ₹20 lakh in monthly sales is an important milestone, but marketplace growth doesn’t stop there.
The next stage is to continue working on:
- Scaling high-performing products
- Increasing product visibility
- Improving conversion
- Maintaining healthy return levels
- Expanding order volume
- Optimizing product performance
- Identifying new growth opportunities
The objective is to turn a strong month into a repeatable and scalable marketplace growth system.
SellerHelpDesk Meesho Growth Management
SellerHelpDesk supports sellers with:
Meesho Account Management
Product & Catalog Management
Marketplace Growth
Product Performance Analysis
Advertising Management
Sales Optimization
Order & Performance Monitoring
Marketplace Operations
Our goal is to help sellers move beyond simply being present on a marketplace and build a business that can grow consistently with data-driven management.
The Result
₹20,00,865 Sales in July 2026
8,742 Orders
14.3% Conversion Rate
6.12 Lakh Views
1.86 Lakh Clicks
3.8% Return Rate
The dashboard also shows +78% sales growth and +56% order growth in its comparison metrics.
Want to Scale Your Meesho Business?
If you’re selling on Meesho and want to improve visibility, orders, conversion and monthly sales, SellerHelpDesk can help manage and optimize your marketplace operations.
From marketplace management to measurable growth.
Client Confidentiality
To protect client confidentiality, seller name, brand name, product IDs, SKU details and other identifying information have been intentionally excluded from this case study.
Performance figures are based on the supplied Meesho Business Dashboard for 1 July 2026–31 July 2026. Comparison percentages are presented as displayed by the dashboard and may reflect Meesho’s selected comparison period. Results may vary based on products, pricing, competition, inventory, marketplace demand and other factors.
Leave a Reply